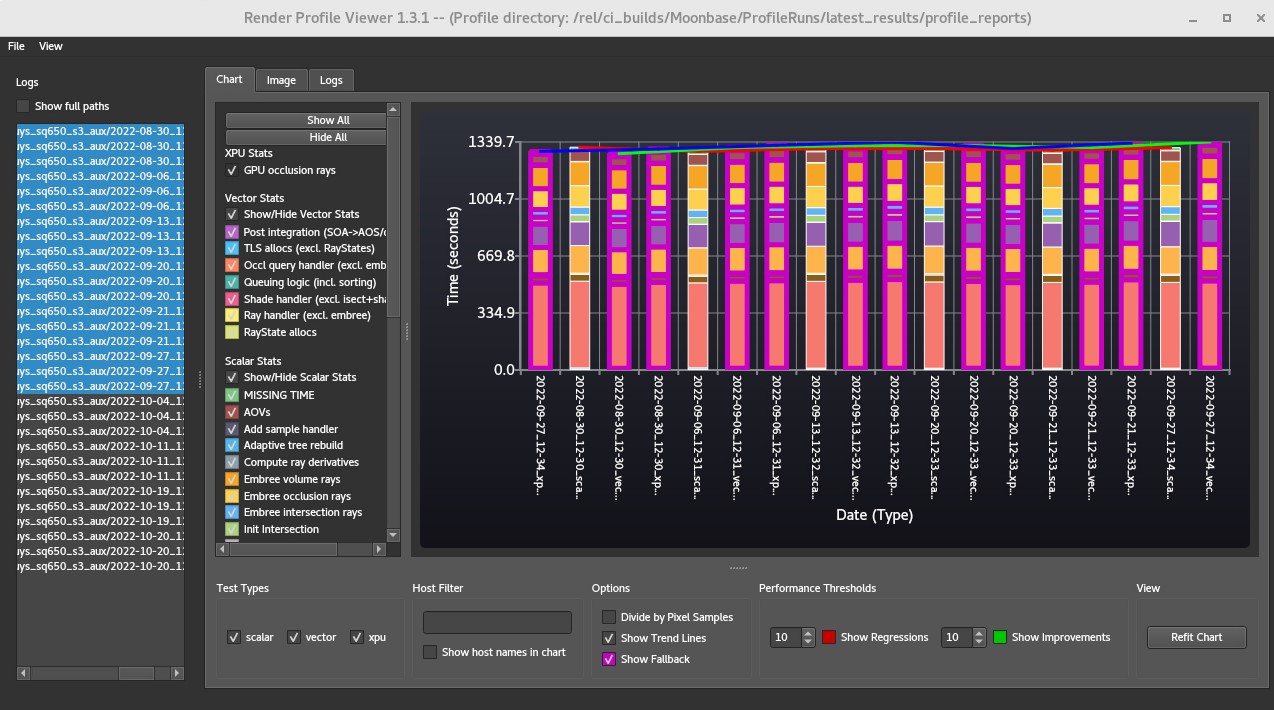
Render Profile Viewer
The render_profile_viewer is a standalone command-line application that graphs and compares statistics read from MoonRay render logs.
The logs must be written using the -info option when rendering in order to include the extra information required by the render_profiler_viewer tool.
Usage
render_profile_viewer [-h] [logs [logs ...]]
Where logs is either a list of log files or a directory containing log files.
Requirements
This tool requires several Python modules in order to run and can be installed on a system using the following:
cd <install_dir>/python/render_profile_viewer
pip install .
Log List
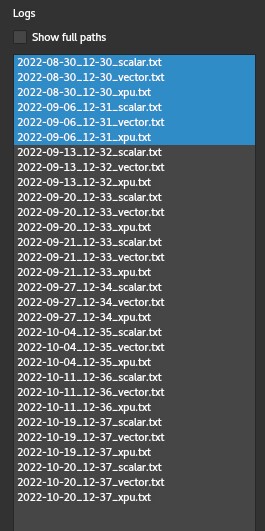 The log list shows all of the logs that have been loaded into the viewer. If the paths are too long, the Show full paths checkbox can be toggled off.
To view one or more logs in the graph pane, simply select them using the shift or control keys.
The log list shows all of the logs that have been loaded into the viewer. If the paths are too long, the Show full paths checkbox can be toggled off.
To view one or more logs in the graph pane, simply select them using the shift or control keys.
Stats
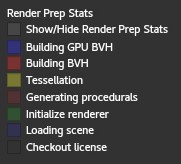
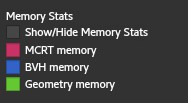
The stats pane controls which stats to view in the graph. It’s divided into three sections: mcrt rendering, render prep, and memory. Only the mcrt rendering stats are checked by default.
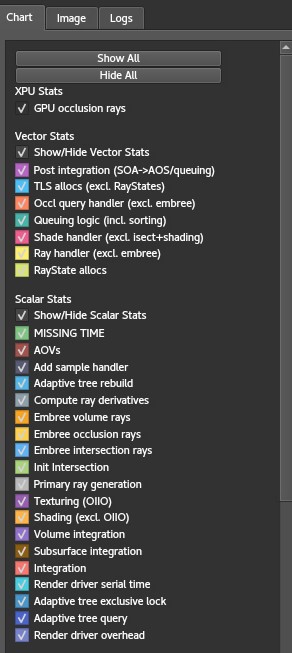
Enabling any of the render prep stats will stack them under the mcrt stats in the graph.
Enabling the memory stats will disable the mcrt stats since memory is measured in gigabytes and mrct is measured in time.
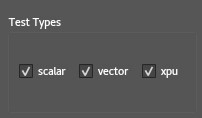
Test Types
If the log files have a suffix for the type of render ( _scalar, _vector, or _xpu) then these toggles will filter which tests are shown in the graph.
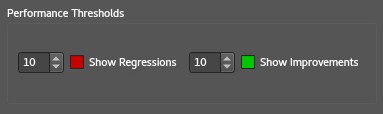
Performance Thresholds
These checkboxes can be toggled on to highlight adjacent tests that perform worse or better than the specified percentage threshold. By default, tests that are 10% slower or faster are highlighted.
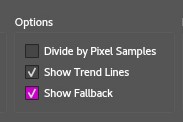
Options
This sections covers miscellaneous options that can be used.
Divide by Pixel Samples will divide all of the timing values by the number of pixel samples. This allows the cost of a pixel sample to be better determined.
Show Trend Lines overlays graph lines between adjacent tests to allow trend visualization.
Show Fallback will highlight any tests that were set to execute in vector or xpu mode and fell back to scalar due to feature limitations.
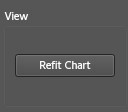
View
The Refit Chart button will manually reframe the view to fit all of the selected tests.
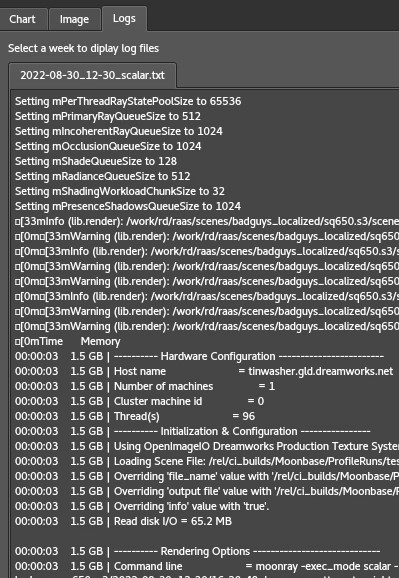
Logs
The Logs tab can be used to view the actual render logs.